Найти Посты: RTS

Ислам
 thinkorswim
Здравствуйте помогите в поиске данных индикаторов на скрине, с первого скрина надо стрелки если есть у кого нибудь)) а со второй точки

Проголосовало: 0

Forex Promoter
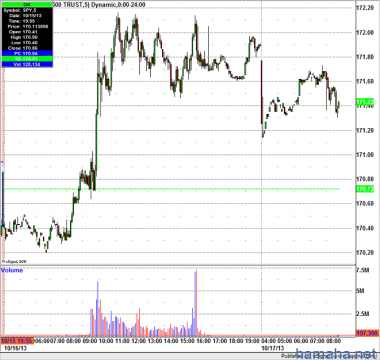
Ближайший уровень поддержки по SPY
(ETF
на индекс SP 500) — 171.00, уровень сопротивления — 172.10. Фьючерсы на индексы незначительно понижаются <div style="width:10px; height:10px"></div><b>Акции, торгующиеся на премаркете в положительной зоне</b> SVU
+6.4%, BTU
+4.5%, WGO
+3.7%, VZ
+3.5%, SYT
+3.2%, STLD
+2.8%, NE
+2.4%, SNDK
+1.8%, LHO
+1.7%, DEO
+1.7%, PPG
+1.7%, CYS
+1.6%, NTCT
+1.4%, AXP
+0.3%, EXPO
+0.1%.<div style="width:10px; height:10px"></div> <b>Акции, торгующиеся на премаркете в отрицательной зоне</b> SCSS
-26.4%, IBM
-6.3%, USG
-5.6%, RDA
-5.3%, XLNX
-4.6%, EBAY
-4.2%, UNH
-2.9%, GS
-2.5%, BX
-1.9%, DGX
-1.7%, FLR
-0.9%, EWBC
-0.9%. <div style="width:10px; height:10px"></div><b>Отчетные бумаги Сегодня перед открытием:</b> ADS
, AMRB
, APH
, BAX
, BBT
, BGG
, BTU
, BX
, CBF
, CY
, DGX
, DHR
, DOV
, FCFS
, FCS
, FITB
, GS
, HBAN
, HLSS
, HOMB
, IIIN
, MTB
, NTCT
, NUE
, ORB
, OSTK
, PENN
, PM
, POOL
, PPG
, PVTB
, SASR
, SFNC
, SNA
, SON
, SVU
, SYNT
, TZOO
, UNH
, UNP
, UTEK
, VZ
, WGO
. <div style="width:10px; height:10px"></div>Вчера после закрытия: AF
, ALB
, AXP
, CCK
, CLB
, CNS
, CYS
, EBAY
, EPB
, EWBC
, EXPO
, HCCI
, HNI
, IBM
, KMI
, KMP
, KMR
, LHO
, NE
, PCBK
, PTP
, RLI
, SCSS
, SLM
, SNDK
, STLD
, UFPI
, UMPQ
, URI
, XLNX
. <div style="width:10px; height:10px"></div><b>Экономическая статистика по США</b> <div style="width:10px; height:10px"></div>08:30 Initial Claims (Первичные заявки на пособие по безработице). Консенсус-прогноз 330K. Фактическое значение 358K. <div style="width:10px; height:10px"></div>08:30 Continuing Claims (Вторичные заявки на пособие по безработице). Консенсус-прогноз 2900K. Фактическое значение 2859K. <div style="width:10px; height:10px"></div>08:30 Housing Starts (Закладки новых домов). Консенсус-прогноз 915K. <div style="width:10px; height:10px"></div>08:30 Building Permits (Выданные разрешения на строительство). Консенсус-прогноз 932K. <div style="width:10px; height:10px"></div>09:15 I
Ближайший уровень

Проголосовало: 0

Роман
 Реал трейды nyse
Сделки 11.10.2013

Проголосовало: 0

House Dr
 thinkorswim
Привет ребята,еще не очень разобрался как работает HAMAHA,но да ладно...Вопрос такой,- в свиме есть лента,почему никто не сделал Футпринт,или его подобие?Ну то есть почему нет индикатора похожего на Футпринт?И сразу задам следующий вопрос,а вдруг кто-то ответит.Можно ли как-то в ниньзю засунуть котировки с найс?Ну чтоб все таки Футпринтом пользоваться.Или может есть другая платформа для этого?Заранее спасибо за ответ!

Проголосовало: 0

Ара
 Реал трейды nyse
торговля сегодня 7/16/13

Проголосовало: 0

Дмитрий
 Реал трейды nyse
 thinkorswim
Подскажите как переписать индикатор МТ4 Super-signals_v2.mq4 для thinkorswim? indicator_chart_window indicator_buffers 4 indicator_color1 Yellow indicator_color2 Lime indicator_color3 Red indicator_color4 Aqua indicator_width1 1 indicator_width2 1 indicator_width3 1 indicator_width4 1 //input properties extern int dist2 = 21; extern int dist1 = 14; extern bool alertsOn = true; extern bool alertsOnCurrent = true; extern bool alertsMessage = true; extern bool alertsSound = true; extern bool alertsEmail = false; double b1[]; double b2[]; double b3[]; double b4[]; int init() { SetIndexBuffer(0,b1); SetIndexBuffer(1,b2); SetIndexBuffer(2,b3); SetIndexBuffer(3,b4); SetIndexStyle(0,DRAW_ARROW); SetIndexArrow(0,334); SetIndexStyle(1,DRAW_ARROW); SetIndexArrow(1,333); SetIndexStyle(2,DRAW_ARROW); SetIndexArrow(1,233); SetIndexStyle(3,DRAW_ARROW); SetIndexArrow(0,234); return(0); } int start() { int counted_bars=IndicatorCounted(); int i,limit,hhb,llb,hhb1,llb1; if(counted_bars<0) return(-1); if(counted_bars>0) counted_bars--; limit=Bars-counted_bars; limit=MathMax(limit,dist1); limit=MathMax(limit,dist2); // // // // // for (i=limit;i>=0;i--) { hhb1 = Highest(NULL,0,MODE_HIGH,dist1,i-dist1/2); llb1 = Lowest(NULL,0,MODE_LOW,dist1,i-dist1/2); hhb = Highest(NULL,0,MODE_HIGH,dist2,i-dist2/2); llb = Lowest(NULL,0,MODE_LOW,dist2,i-dist2/2); b1[i] = EMPTY_VALUE; b2[i] = EMPTY_VALUE; b3[i] = EMPTY_VALUE; b4[i] = EMPTY_VALUE; double tr = iATR(NULL,0,50,i); if (i==hhb) b1[i]=High[hhb] +tr; if (i==llb) b2[i]=Low[llb] -tr; if (i==hhb1) b3[i]=High[hhb1]+tr/2; if (i==llb1) b4[i]=Low[llb1] -tr/2; } // // // // // if (alertsOn) { int forBar = 1; if (alertsOnCurrent) forBar = 0; if (b1[forBar] != EMPTY_VALUE && b3[forBar] != EMPTY_VALUE) doAlert("strong sell";); if (b1[forBar] != EMPTY_VALUE && b3[forBar] == EMPTY_VALUE) doAlert("sell";); if (b1[forBar] == EMPTY_VALUE && b3[forBar] != EMPTY_VALUE) doAlert("minor sell or exit buy";); if (b2[forBar] != EMPTY_VALUE && b4[forBar] != EMPTY_VALUE) doAlert("strong buy";); if (b2[forBar] != EMPTY_VALUE && b4[forBar] == EMPTY_VALUE) doAlert("buy";); if (b2[forBar] == EMPTY_VALUE && b4[forBar] != EMPTY_VALUE) doAlert("minor buy or exit sell";); } return(0); } // // // // // void doAlert(string doWhat) { static string previousAlert="nothing"; static datetime previousTime; string message; string TimePeriod; if (Period()== 1) TimePeriod = "1 MIN"; if (Period()== 5) TimePeriod = "5 MIN"; if (Period()== 15) TimePeriod = "15 MIN"; if (Period()== 30) TimePeriod = "30 MIN"; if (Period()== 60) TimePeriod = "1 HR"; if (Period()== 240) TimePeriod = "4 HR"; if (Period()== 1440) TimePeriod = "DAILY"; if (Period()== 10080) TimePeriod = "WEEKLY"; if (Period()== 43200) TimePeriod = "MONTHLY"; if (previousAlert != doWhat || previousTime != Time[0]) { previousAlert = doWhat; previousTime = Time[0]; // // // // // message = StringConcatenate(Symbol()," at ", TimePeriod, " Super signal : ",doWhat); if (alertsMessage) Alert(message); if (alertsEmail) SendMail(StringConcatenate(Symbol(),"Super signal ";),message); if (alertsSound) PlaySound("alert2.wav";); } }

Проголосовало: 0

Forex Promoter
 Акции в игре на сегодня
Компании торгуются ниже на пост маркете, реакция на отчёты: OCLR -19.1%, VCLK -15.4%, RBCN -14.3%, SYNC -9.9%, CHRW -6.4%, CA -6.3%, SYMC -5.8%, PRTS -5.5%, SGMS -5.5%, FRGI -5%, JAZZ -5%, Z -3.8%, CLMS -2%, TRIP -1.8%, ENPH -1.7%, MRO -1.7%, SD -1.7%, GCAP -1.7%, DIS -1.4%, SCMP -1.3%, RLOC -1.3%, MNTG -1.3%, ONE -1.2%, OAS -1.1%, MAKO -1.5%. Компании торгуются ниже на пост маркете, реакция на новости: CIE
-6.7% (объявил вторичное размещение 50 млн. обыкновенных акций), DDD
-6.7% (объявили $ 250 млн. публичного предложения и размещения до 1,3 млн. акций), JMI
-3.3% (объявлено публичное размещение 6 млн. обыкновенных акций), ANR
-2.4% (публичное размещение 6 млн. обыкновенных акций), APO
-2.4% (объявила о начале публичного размещения 21,2 млн. акций класса А), REN
-2.3% (объявили размещение 13,25 млн. обыкновенных акций), BIP
-2.2% (подано предложение Limited Partnership Unit), WBS
-2.1% (объявили вторичное размещение ~ 8,74 млн. обыкновенных акций)

Проголосовало: 0

Ара
Pattern Recognition And Tape Reading Skill. When there is a real institutional buyer or seller in a stock, they never show their hand until they are almost done. Think about it, a real buyer is not going to say to the world, look at me, I have so much stock to buy, please lift all the offers so I have to pay up to get my stock. No, he is showing that bid because he has been buying the stock all day with no bids and now, that is all the stock he has left and wants to get hit. And he will get hit. When you see these bids, you sell into them hard all day long provided the stock is weak and you know there are sellers in the stock. Trying to buy stocks with large bids and sell stocks with large offers is a sign of a dumb trader that jumps in front of size only to see that size hit and then quickly is sitting on a losing trade. Most of the time, especially with small and mid cap stocks, you would see 100 shares on the bid or maybe 300 shares on the bid, and it would be stepping up all day long. You never see the bid get hit, or if you did, you would see 300 shares bid, then 2k shares would go off at the bid and he would still be there with 300 bid. Very classic. This guy has a lot of stock to buy. And he would never show his hand. When a large offer would show up, the dumb traders would quickly run to sell. The buyer would be there or the specialist buying all the cheap shares from the dumb traders. When the dumb traders were done selling, the 300 share bid would step to the size offer and suddenly the offer would get lifted in one print, bamm, gone. Now those 300 shares are stepping up again and the dumb traders are all bitching about how the stock is manipulated. This would go on all day every day. The dumb traders would never learn. If the stock is strong and near the high of the day, you would be looking to buy the stock. But in general, even if the stock is strong, if he is showing size, it means that is probably all he has left and he will be done and the stock will trade lower the rest of the day. Remember, the reason the buyer is showing his hand is because he has already bought all his stock. He will never show his hand if he still has stock to buy. Would you? When there is a buyer in the stock he usually has a level where he wants to buy the stock. As the day goes on and other buyers come into the stock, this level goes higher and higher, hence the bid stepping up. The key is to find these levels. They usually are not at round numbers and they are not at key support levels. It could be something like 100.57. You will notice there is a bid at .55 for 200 shares and you will see large prints going off at .57. You will never see the stock trade at the bid. This is your buyer. You would want to be buying the stock around this area. And since you know the buyer is resting at .57, as soon as the price trades, you know to get out. Pattern recognition skills are very important. You need to find the pattern. Every specialist is different. One of the things you will notice with very strong or a very weak stock is the charts are very smooth. If you are seeing a lot of volatility, there probably isn't a real buyer there, but rather a lot of momentum traders. You may be fooled by the size. You might mistake them for large institutions. The difference is, traders may trade size, but there is nothing behind it that is why the stocks drop so fast and go back and forth. If it were a real fund with hundreds of thousands of shares to buy or millions, they would be bid for that stock. You wouldn't see sharp drops. Being able to know the difference is paramount. Specialist knows that the buyer has size to buy and he is going to help him work the order. The specialist knows who the size players are. He knows who the buyers and sellers are and how much stock they have to buy and sell. That is his job. The specialist is also interesting in making money and if he has a big buyer at his post, he is going to want to buy as much stock as he can. Now how he is going to accomplish that if he is showing the full size of the buyer? The specialist cannot get long on an uptick and cannot get short on a downtick. He needs to buy on downticks. He needs you to sell your stock to him. He will never show you the size of the buyer. He will do everything he can to make the stock look weak. He will step up on 100 or 200 shares. Tape reading has not changed in a 100 years. The bottom line is, real institutional buyers and sellers never show their size until they are done. It's all patterns. When a buyer is accumulating stock, he will usually bid in even amounts; you will see 500 or 300 on the bid. Keep in mind, this is a trick, he has far more than 300 shares to buy. But what you will see are the prints, 5k goes off, 10k goes off, 25k goes off, so on. When he is done, he will show you his bid. And this bid will usually be an odd number. When you see a size bid show up for 13,600 shares. Hit that bid as fast as you can. He's done! Now if you see him come back for 300 shares because he has been bidding 300 all day. You might want to get back in. Also, other things to look for are uptick bids. If you are still seeing uptick bids, he is still there. The key here is pattern recognition. You have to identify the patterns. It's very much like a game of chess. He will telegraph his moves. You just have to catch them.

Проголосовало: 0

Ара
We want to buy at strong demand levels where the supply is very thin and prices are likely to rise. We want to sell at supply levels where the supply of stock overwhelms the feeble demand that may be there. Prices will halt and reverse when the current trend no longer has the pressure to sustain itself and the opposite pressure exerts itself. We must focus on how strong the opposing pressure is at those levels. For example, we buy at demand levels because they were turning points in the past. They are levels where prices could not continue to drop and started to rise. This occurs as the supply is becoming exhausted as sellers dump shares onto the market. Eventually, prices become so cheap that willing buyers jump in and support the price. When the demand from these buyers exceeds the existing supply from sellers, prices will rise. We focus on that area as an area of demand where we will buy again in the future. When we enter into a long trade, we want to buy at the strongest level of demand in order to have a high probability for success. Most traders think incorrectly that all turning points where prices rose will act as demand. We need to be selective in our trading. We want to find the strongest levels of demand for the best trading opportunities. Those strong levels identify themselves in the way that price leaves the level. Think of a glass filled with water. If you grab hold of the glass and it is filled with lukewarm water, you will be able to hold the glass for as long as you’d like. However, if you grab a glass filled with scalding hot water, you are likely to let go of it very quickly. Demand levels work the same way. If prices enter that area and then move sideways or slowly leave the area, there is not strong buying pressure there and it is a weaker demand level. However, if prices barely enter demand and move quickly away, there is strong buying pressure there and you want to use those areas as buying points in the future. Supply levels work the same way with selling pressure dominating buyers.

Проголосовало: 0

Фильтр

Что искать
Тип постов
По людям В группе Дата
Наш канал