Найти Посты: level II

Ара
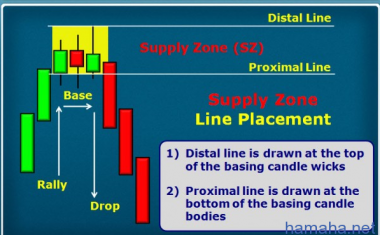
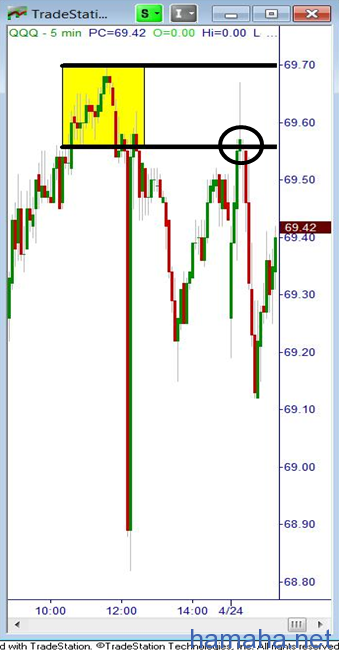
Rally base drop, drop base drop, resistance, Fibonacci, Elliot Wave, and on and on…all attempts to figure out where price will turn in a market. For today’s piece, I thought I would literally take a page right out of our Professional Trader course to help share the picture that represents real supply or demand in a market. We will also look at a recent trade example from one of our live trading rooms, the Extended Learning Track (XLT). For today’s lesson, let’s focus on the supply side as that is what we focused on in a recent XLT session. Notice the pattern, Rally – Base – Drop. This is the picture of supply that helps you be a willing seller high up on the supply and demand curve. While some may look at the Drop – Base – Drop as a supply level, keep in mind it is found in the middle of moves, unlike the Rally – Base – Drop that is found farther out at the extremes. With any picture of supply, you need to make sure it is very “fresh” meaning there are still significant unfilled sell orders in that area (price level). The entry once the picture above is produced is to short a rally back up to that supply level. The “drop” from the level tells us supply exceeds demand in that area. We sell short at the proximal line with a protective buy stop just above the distal line and that’s the sell setup. Again, keep in mind that a section that comes later in the course deals with the ever important “Odds Enhancers” which are the filter that helps us identify the best levels with the strongest supply and demand imbalances so make sure you understand those before trying this at home. I have also written about them in prior articles. The yellow shaded box represents supply in the QQQ. Notice the pattern prior to the yellow box, the yellow box itself, and after: Rally – Base – Drop. Once price rallied back up to that level, the shorting opportunity is at hand if you wish to take the trade. These are typical of our early morning income trades. This is not about taking many trades in a session, it’s about taking the high probability ones that meet our criteria. There is nothing fancy about this, no indicators or oscillators or conventional chart patterns, there are not many different strategies, there is simply one. Buy where institutions are buying and sell where they are selling. Another way to say that is, buy where the smart money is buying and sell where the smart money is selling. The purpose of this article was to help you identify what the picture of that looks like on a chart. Of course, the Odds Enhancers help this process immensely and are key to identifying the key levels.
Проголосовало: 0

Ара
We want to buy at strong demand levels where the supply is very thin and prices are likely to rise. We want to sell at supply levels where the supply of stock overwhelms the feeble demand that may be there. Prices will halt and reverse when the current trend no longer has the pressure to sustain itself and the opposite pressure exerts itself. We must focus on how strong the opposing pressure is at those levels. For example, we buy at demand levels because they were turning points in the past. They are levels where prices could not continue to drop and started to rise. This occurs as the supply is becoming exhausted as sellers dump shares onto the market. Eventually, prices become so cheap that willing buyers jump in and support the price. When the demand from these buyers exceeds the existing supply from sellers, prices will rise. We focus on that area as an area of demand where we will buy again in the future. When we enter into a long trade, we want to buy at the strongest level of demand in order to have a high probability for success. Most traders think incorrectly that all turning points where prices rose will act as demand. We need to be selective in our trading. We want to find the strongest levels of demand for the best trading opportunities. Those strong levels identify themselves in the way that price leaves the level. Think of a glass filled with water. If you grab hold of the glass and it is filled with lukewarm water, you will be able to hold the glass for as long as you’d like. However, if you grab a glass filled with scalding hot water, you are likely to let go of it very quickly. Demand levels work the same way. If prices enter that area and then move sideways or slowly leave the area, there is not strong buying pressure there and it is a weaker demand level. However, if prices barely enter demand and move quickly away, there is strong buying pressure there and you want to use those areas as buying points in the future. Supply levels work the same way with selling pressure dominating buyers.

Проголосовало: 0

Алексей
Будущая цена пары Доллар-Йена, планируется движение нисходящее до уровня 98.05 - анализ = 100 % Новости в мире бизнеса 25 апреля 2013 Время по Гринвичу 09:33 . Информация получена из источников над национальных и над государственных органов управления информация , а также суверенных фондов благосостояния. The future price of a pair of dollar-yen, will move downward to the level of 98.05 - Analysis = 100% news in the world of business April 25, 2013 9:33 GMT. Information is obtained from sources on the national and state controls over information, as well as sovereign wealth funds.

Проголосовало: 0

Denis Popov
 Arche платформа скачать
В окне Level II не сохраняются HotButtons (типа "buy 100 bid" и т.д.) после редактирования жму правой на окне и выб. "сохр.тек.парам." Если же терминал перегрузить панель горячих кнопок опять по умолчанию становиться (2 кнопки) хотя все ост.настройки по Level II сохраняются. Что зделать подскажет кто?

Проголосовало: 0

Алексей
EURO USD 2012/12/26 IN THE forex the market be is at the level testings the to 13 385 EURO USD 26/12/2012 на валютном рынке будет на уровне тестирования до 13 385 Information for insiders Информация для инсайдеров owning information seek to communicate and make friends владеющие информацией стремятся общаться и дружить

Проголосовало: 0

United States Department of Defense December 24, 2012.JPG · 126KB
Женя
 Реал трейды nyse
15 ноября - настроил Arche - неплохие входы были по фильтру Level

Проголосовало: 0

Denis Popov
 Arche платформа скачать
добрый... как убрать сетку в Level II?помню что нужно файл *.ini где то создать в папке программы с какими то параметрами....

Проголосовало: 0

Forex Promoter
 thinkorswim
В видео детально описываю процесс регистрации аккаунта в TD Ameritrade. На выходе получаем возможность пользоваться одновременно STRATEGY DESK и thinkorswim, без задержек, со всеми подписками первого уровня в Level II
В видео детально описываю

Проголосовало: 0

Максим
HAMAHA  
 thinkorswim
Свежая формула. Расчет потенциала хода бара сегодняшнего дня, исходя из прошлых баров. + это сколько еще в среднем может пойти, - на сколько больше ход от среднего движения. def AvgPeriod = 50; def r = AbsValue(open-close); def av = (r/average(r,AvgPeriod))100
; def level = 100; plot posmove = roundup(((level - av)/100)* average(r,AvgPeriod),2);

Проголосовало: 0

Andrew
 thinkorswim
Всем Доброго времени суток! Прошу умельцев писать под ТОС, дать мне подсказку или если есть возможность помочь решить задачу. Начал писать индюк смысл таков: Расчитал уровни которые хотел бы использовать, их оказалось много, сразу реши сделать так, Выводить уровни только когда цена находится на одном из них. Пример: Plot level = if dailylow <= Flevel1 and dailyclose > Flevel1 then FLevel1 else If ... и так далее по всем уровням. Проблема сложилась такого рода, как только условие выполнено хоть раз, цикл прирывается и само сабой дальше уровни не отображаются.Вопрос: Как мне загнать это в цикл, который будет работать постоянно? Тоесть если лоу пришол н ауровень показать его, если цена пошла дальше, убрать первый и поставить следующий! Зарание благодарю и жду ответа!

Проголосовало: 0

Страницы: Первая 3 4 5 6 7

Фильтр

Что искать
Тип постов
По людям В группе Дата
Наш канал