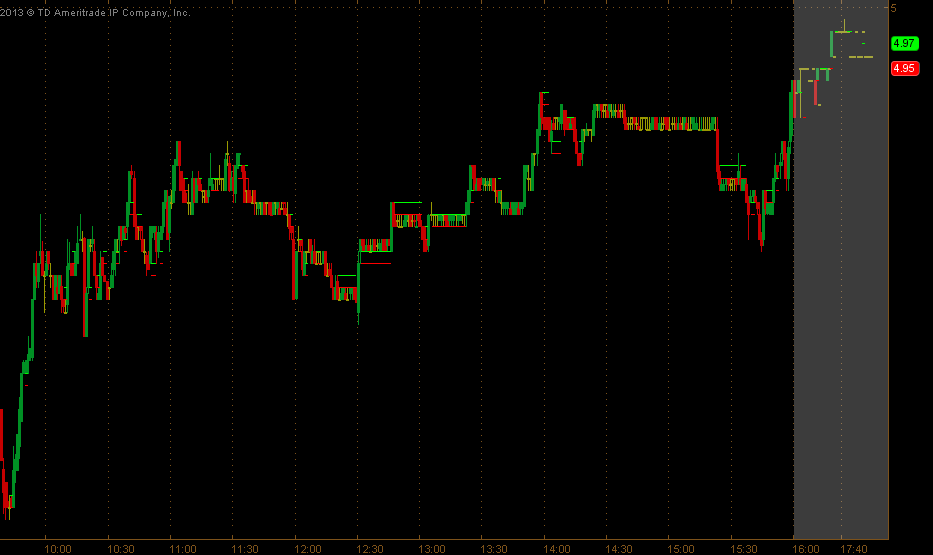
#Сырая идея по поводу отображения Bid & Ask на графике, кому интересно может развить и усовершенствовать plot ask = close(priceType = "ASK"
")
; input offset=0; input length = 1; def sma = SimpleMovingAvg(ask, 1, length); rec line = if IsNaN(sma) then line[1] else sma[offset]; plot askline=if isnan(sma) then line else double.nan; askline.setpaintingStrategy(paintingStrategy.LINE); askline.setlineWeight(3); askline.setdefaultColor(color.green); askline.hideBubble(); plot bid = close(priceType = "BID"
; input offset2=0; input length2 = 1; def sma2 = SimpleMovingAvg(bid, 1, length2); rec line2 = if IsNaN(sma2) then line2[1] else sma2[offset2]; plot bidline=if isnan(sma2) then line2 else double.nan; bidline.setpaintingStrategy(paintingStrategy.LINE); bidline.setlineWeight(3); bidline.setdefaultColor(color.red); bidline.hideBubble();


Chart settings-->Time Axis-->поставь галочку напротив Keep Time Zoom
Май 02 2013, 11:37СПС!!!
Май 02 2013, 16:39