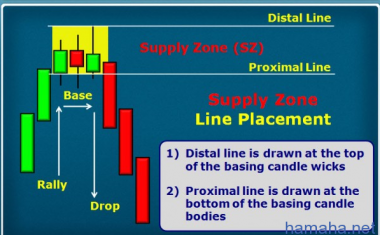
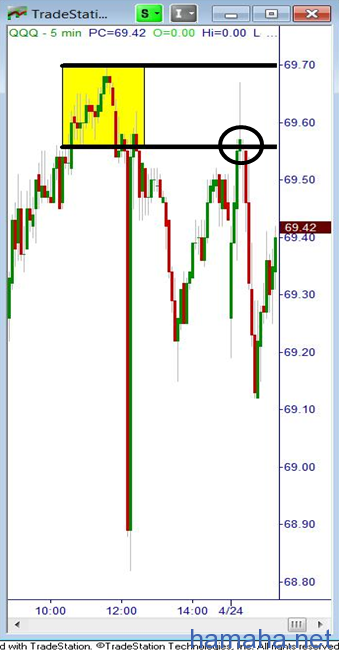
Rally base drop, drop base drop, resistance, Fibonacci, Elliot Wave, and on and on…all attempts to figure out where price will turn in a market. For today’s piece, I thought I would literally take a page right out of our Professional Trader course to help share the picture that represents real supply or demand in a market. We will also look at a recent trade example from one of our live trading rooms, the Extended Learning Track (XLT). For today’s lesson, let’s focus on the supply side as that is what we focused on in a recent XLT session. Notice the pattern, Rally – Base – Drop. This is the picture of supply that helps you be a willing seller high up on the supply and demand curve. While some may look at the Drop – Base – Drop as a supply level, keep in mind it is found in the middle of moves, unlike the Rally – Base – Drop that is found farther out at the extremes. With any picture of supply, you need to make sure it is very “fresh” meaning there are still significant unfilled sell orders in that area (price level). The entry once the picture above is produced is to short a rally back up to that supply level. The “drop” from the level tells us supply exceeds demand in that area. We sell short at the proximal line with a protective buy stop just above the distal line and that’s the sell setup. Again, keep in mind that a section that comes later in the course deals with the ever important “Odds Enhancers” which are the filter that helps us identify the best levels with the strongest supply and demand imbalances so make sure you understand those before trying this at home. I have also written about them in prior articles. The yellow shaded box represents supply in the QQQ. Notice the pattern prior to the yellow box, the yellow box itself, and after: Rally – Base – Drop. Once price rallied back up to that level, the shorting opportunity is at hand if you wish to take the trade. These are typical of our early morning income trades. This is not about taking many trades in a session, it’s about taking the high probability ones that meet our criteria. There is nothing fancy about this, no indicators or oscillators or conventional chart patterns, there are not many different strategies, there is simply one. Buy where institutions are buying and sell where they are selling. Another way to say that is, buy where the smart money is buying and sell where the smart money is selling. The purpose of this article was to help you identify what the picture of that looks like on a chart. Of course, the Odds Enhancers help this process immensely and are key to identifying the key levels.


 Наверх
в розенблат - а это что ? Конкретней
Дек 17 2015, 01:12rosenblatt securities imbalance tracker сервис но платный
Дек 17 2015, 01:14А бесплатно что нибудь есть , ?
Дек 17 2015, 01:15